Reviewing Embed Experience Video Analytics
The Embed Experience video analytics provide analytics on video performance and engagement. To review the video analytics, edit the experience and click Experience Analytics > Videos in the left navigation.
This topic includes the following sections:
Selecting a time span
To specify the time period for the report, you can click on a quick date or use the calendar control.
Using a quick date
A series of quick dates are at the top of the page. The following quick dates are available:
- Today
- Yesterday
- Last 7 days
- Last 30 days
- This month - The calendar month to date - for example, if today is March 17, this report will display March 1 - March 17
- Last month - The previous calendar month - for example, if today is February 14, this report will display January 1 - January 31.

Click on a quick date to update the report.
Using the calendar control
You can also select a start and end dates by clicking on the calendar control.
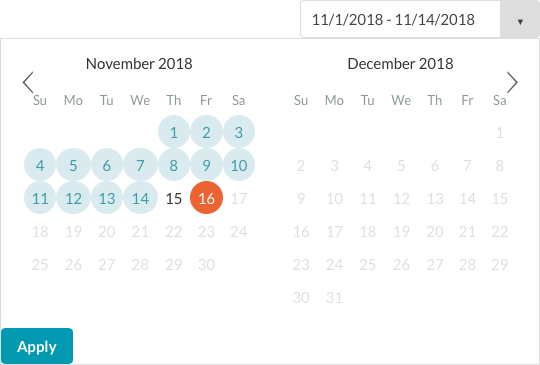
Click Apply to update the report.
Reporting time zone
Data is based upon the account's reporting timezone. The reporting time zone is used to calculate day boundaries for reporting data. Changing the reporting time zone setting only affects data going forward, and changes are not applied retroactively. If you change the timezone setting, you may see a flat spot or a spike in your data when looking at day boundaries where the change was applied. Updates to the timezone setting may not take effect immediately, and analytics data may continue to refer to the old setting until the system processes the changes.
The reporting time zone can be configured as part of the account settings. For information on changing the reporting time zone, see Managing Account Settings.
Reviewing performance analytics
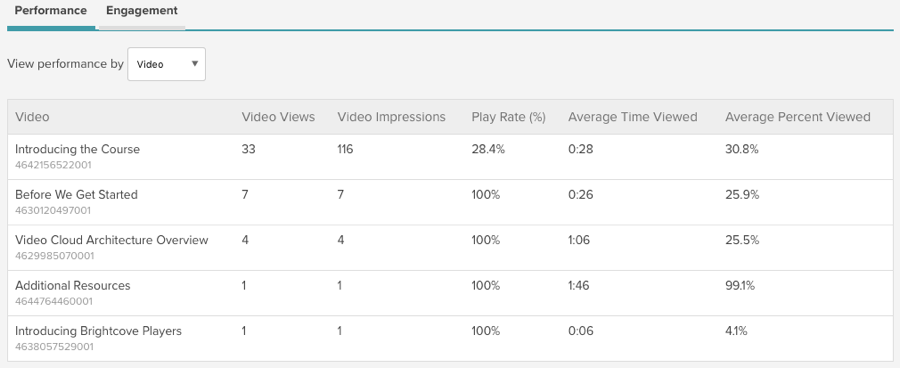
To review the performance analytics, click Experience Analytics > Videos in the left navigation and then click Performance in the page header. By default, performance data is displayed by Video. The following data for the videos in the experience will display:
- Video Name and ID
- Video Views - The number of times a video started playing, recorded when the stream is started (does not include rewind or replay); it is not a measure of individual viewers
- Video Impressions - The number of times the video was loaded into a player and ready for interaction
- Play Rate (%) - The percentage of users that played the video after it was loaded (Video Views divided by Video Impressions)
- Average Time Viewed - The average time viewers spent watching the video
- Average Percent Viewed - The average percent of the video that was viewed (average time viewed divided by the video length)
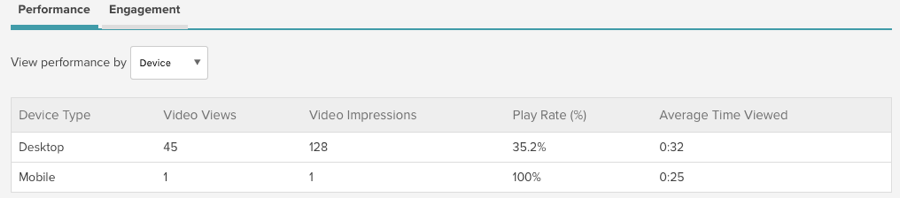
Select Device to view the performance by device. Possible device types are:
- Desktop - Includes desktop and laptop computers
- Tablet - Includes iPads, Android tablets, etc.
- Mobile - Mobile phones
- Connected TV/Game Console/Companion Device - Includes Smart TVs, set-top boxes and game consoles
- Other - For user-agents which are not mapped to any of the above
Performance can also be viewed by Country and Day.
The following data for the videos in the experience will display:
- Device Type
- Video Views - The number of times a video started playing, recorded when the stream is started (does not include rewind or replay); it is not a measure of individual viewers
- Video Impressions - The number of times the video was loaded into a player and ready for interaction
- Play Rate (%) - The percentage of users that played the video after it was loaded (Video Views divided by Video Impressions)
- Average Time Viewed - The average time viewers spent watching the video
Reviewing engagement analytics
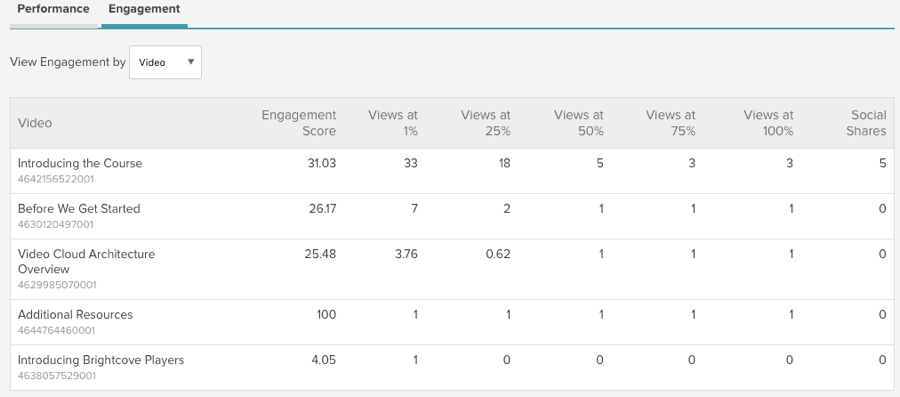
To review the performance analytics, click Experience Analytics > Videos in the left navigation and then click Engagement in the page header. By default, engagement data is displayed by Video but can also be displayed by Day.
The engagement analytics will display the following data for the videos in the experience:
- Video Name and ID
- Engagement Score - The average percent watched per video view (calculated by adding all the percentage watched divided by the number of Video Views). For more information on how this is calculated, see Calculating Video Engagement Score
- Views at 1% - How many views were recorded at the 1% point of the video
- Views at 25% - How many views were recorded at the 25% point of the video
- Views at 50% - How many views were recorded at the 50% point of the video
- Views at 75% - How many views were recorded at the 75% point of the video
- Views at 100% - How many views were recorded at the 100% point of the video
- Social Shares - How many times the video was shared to a social media account