Reviewing Embed Experience Calls-to-Action Analytics
The calls-to-action analytics provide analytics on the clickthroughs and form conversions for an Embed Experience. To review the calls-to-action analytics, edit the experience and click Experience Analytics > Calls-to-Action in the left navigation.
Selecting a time span
To specify the time period for the report, you can click on a quick date or use the calendar control.
Using a quick date
A series of quick dates are at the top of the page. The following quick dates are available:
- Today
- Yesterday
- Last 7 days
- Last 30 days
- This month - The calendar month to date - for example, if today is March 17, this report will display March 1 - March 17
- Last month - The previous calendar month - for example, if today is February 14, this report will display January 1 - January 31.

Click on a quick date to update the report.
Using the calendar control
You can also select a start and end dates by clicking on the calendar control.
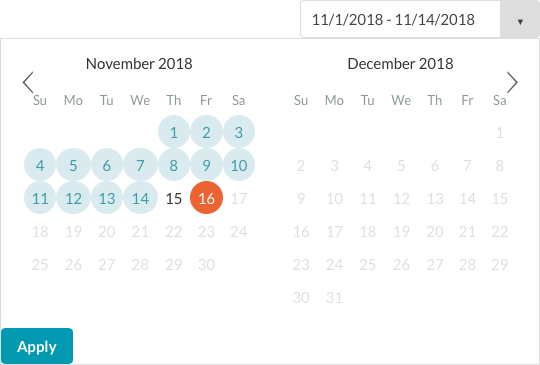
Click Apply to update the report.
Reviewing clickthroughs analytics
Clickthroughs analytics tracks the interactivity in an Embed Experience. The following objects will trigger clickthroughs analytics to be tracked:
- Link interactions configured with a link URL
- Card interactions configured with a link URL
- Image components configured with clickable URLs
To review the clickthroughs analytics, click Experience Analytics > Calls-to-Action in the left navigation and then click Clickthroughs in the page header.
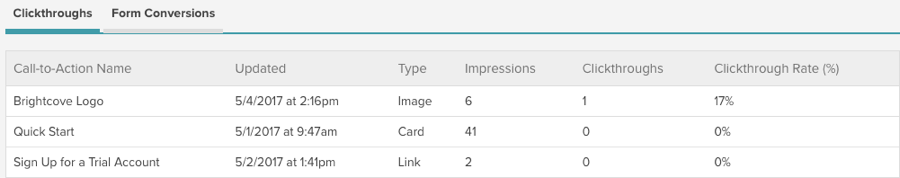
The clickthroughs analytics will display the following data for the experience:
- Call-to-Action Name - The name of the call-to-action:
- Links - Displays the link title
- Cards - Displays the card title
- Images - Displays the name assigned during creation
- Custom HTML - Displays the name assigned during creation
- Updated - The last updated date and time for the interaction
- Type - Type of interaction, link or card
- Impressions - The number of times the interactivity was displayed (with cards, an impression is recorded when the card icon (
 ) appears; the card doesn't have to be displayed for an impression to be recorded)
 - Clickthroughs - The number of times a link was clicked, a link in a card was clicked, or a clickthrough URL on an image component was clicked
- Clickthrough Rate (%) - The percentage of viewers that clicked a link (Clickthroughs divided by Impressions)
Reviewing form conversions analytics
Form conversions analytics tracks the form submission and custom HTML link activity in an Embed Experience. The following objects will trigger form conversions analytics to be tracked:
- Forms that are submitted from HTML companion components
- Forms that are submitted from custom HTML components
- Clickable URLs within custom HTML components
To review the form conversions analytics, click Experience Analytics > Calls-to-Action in the left navigation and then click Form Conversions in the page header.
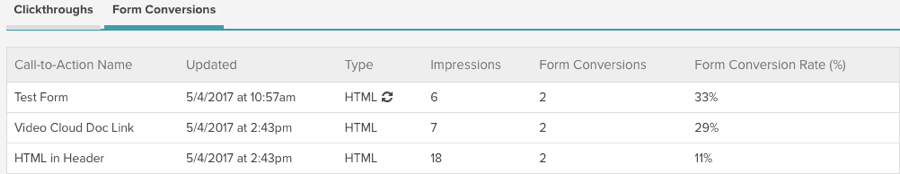
The form conversions analytics will display the following data for the experience:
- Call-to-Action Name - The name of the component (name is assigned when the component is added to the experience)
- Updated - The last updated date and time for the component
- Type - Type of interaction (HTML companion components are indicated with a (
 ) icon
 - Impressions - The number of times the component was displayed
- Form Conversions - The number of times a form was submitted or a URL within a custom HTML component was clicked
- Form Conversion Rate (%) - The percentage of viewers that submitted a form (Form Conversions divided by Impressions)